2023-2024 Annual Report
Facts and Figures
Facts & Figures
We began the 2023 Bridges program year by collaborating with professional educators in 19 school districts to identify and recruit high school students and recent graduates to participate in Bridges from School to Work. These schools included those that referred participants for the third and final year of the NextGen randomized controlled trial with Mathematica, whose details are outlined in the Organizational Achievements section of this annual report.
Three of these school districts are the largest in the nation, including New York City Public Schools, the Los Angeles Unified School District, and Chicago Public Schools.
The National Center for Education Statistics reports that over 400,000 youth with disabilities aged 14 to 21 exit public education each year.
The mission of Bridges from School to Work is to transform the lives of young adults with disabilities through the power of a job.
Since 1989, Bridges has worked with
900 High Schools
28,000 Youth
7,100 Employers
Bridges Demographics
Youth by Gender
%
Male
%
Female
%
Chose not to answer
%
Identified as transgender
%
Identified as non-binary
Youth by Disability Type
Youth by Ethnicity
%
Specific Learning Disabilities
%
have other disabilities, which can include sensory impairments, cerebral palsy, traumatic brain injury, and other disabilities
%
Speech/Language Disorders
%
Autism Spectrum Disorders
%
Intellectual Disabilities
%
Up to 35% of those who have a primary disability also have a secondary or tertiary disabilitiy
%
Other Health Impairments
%
Emotional/Behavioral Disabilities
%
Black
%
Multi-Racial
%
Latino
%
Other
%
White
%
Asian
Bridges Demographics
Youth by Gender
%
Male
%
Female
%
Chose not to Answer
%
Identified as Transgender
%
Identified as Non-binary
Youth by Disability Type
%
Specific Learning Disabilities
%
Autism Spectrum Disorders
%
Other Health Impairments
%
have other disabilities, which can include sensory impairments, cerebral palsy, traumatic brain injury, and other disabilities
%
Intellectual Disabilities
%
Emotional/Behavioral Disabilities
%
Speech/Language Disorders
%
Up to 35% of those who have a primary disability also have a secondary or tertiary disability
Youth by Ethnicity
%
Black
%
Latino
%
Multi-Racial
%
White
%
Other
%
Asian
Among marginalized and underserved youth in the U.S, those with one or more disabilities face some of the greatest barriers to achieving positive post-school outcomes. People with disabilities consistently realize poorer health, education, employment, and economic outcomes — by almost every measure.
Bridges provides comprehensive workforce development services to youth with disabilities ranging in age from 16 to 24. Youth with disabilities who get jobs with the help of programs like Bridges realize increased prospects for career satisfaction, earning potential, lifelong workforce participation, and overall wellbeing.
949 Enrolled
758 were hired in jobs
575 retained jobs for 90 days
483 retained jobs for 180 days
School Districts Served
- Atlanta Public Schools
- Berkeley Unified School District (CA)
- Boston Public Schools
- Chicago Public Schools
- Clayton County Schools (GA)
- Compton Unified School District
- Dallas Independent School District
- Douglas County Schools (GA)
- Fort Worth Independent School District
- Fulton County Schools (GA)
- Garland Independent School District (TX)
- Los Angeles Unified School District
- Marietta City Schools (GA)
- New York City Public Schools
- Oakland Unified School District
- Paulding County Schools (GA)
- San Francisco Unified School District
- School District of Philadelphia
- West Contra Costa Unified School District (CA)
Bridges Quick Facts
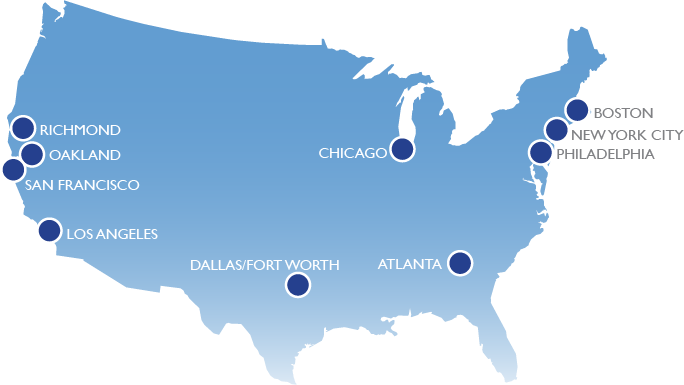
With programs across 10 major U.S. cities, Bridges maintains partnerships with some of the nation’s largest school districts, some which have endured for more than 25 years.

of Bridges participants still live at home with their parent or guardian.
of Bridges participants are still in high school at the time they enroll.
of Bridges participants heard about Bridges through a teacher or through a Bridges employment specialist who visited their high school.
of Bridges participants are between the ages of 17 and 19.

